Five Facts about Frequency Tables!
1. Tallies are used to record data.
2. Intervals are used to group data from least to greatest. Categories can also be used.
3. Frequency is determined by the number of tallies in an interval.
4. It is used to organize data.
5. Organizing data using a Frequency Table can help you answer questions about data.
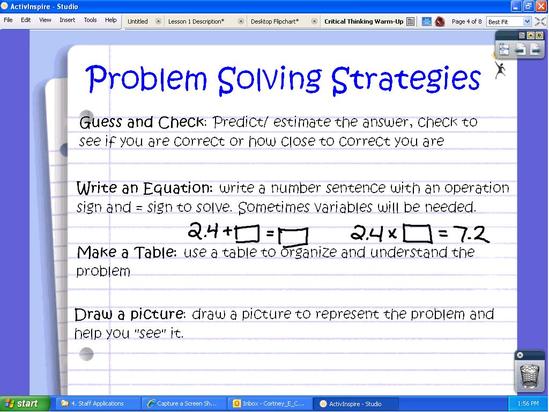
We will continue working on problem-solving strategies and the criteria of a complete response through the remainder of this week (and the whole year!) I've included a few of the problem-solving strategies we went over in class along with a little example of a strategy that might help you with tonight's homework. I've also included our sample problem/explanation from class as a model for your homework tonight.
1. Tallies are used to record data.
2. Intervals are used to group data from least to greatest. Categories can also be used.
3. Frequency is determined by the number of tallies in an interval.
4. It is used to organize data.
5. Organizing data using a Frequency Table can help you answer questions about data.
We will continue working on problem-solving strategies and the criteria of a complete response through the remainder of this week (and the whole year!) I've included a few of the problem-solving strategies we went over in class along with a little example of a strategy that might help you with tonight's homework. I've also included our sample problem/explanation from class as a model for your homework tonight.
Sample from Class
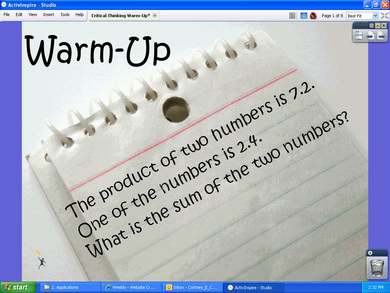
You have to divide 7.2 by 2.4 because the product of two numbers is 7.2 and one of the factors is 2.4. Dividing will help you find the missing factor, 3.0. I decided to add 2.4 and 3.0 because the problem is looking for the sum of these numbers, and I got 5.4.
When writing your response:
1. Think abou the math you used to solve the problem (and why you chose this math... because!)
2. Think about similar problems and how you solved them (what do you know).
3. Look for key words to help you think of a strategy.
When writing your response:
1. Think abou the math you used to solve the problem (and why you chose this math... because!)
2. Think about similar problems and how you solved them (what do you know).
3. Look for key words to help you think of a strategy.
Unit One - Statistics!
Statistics is the science of collecting, organizing, displaying, and interpreting information called data. In this unit, students display, organize, and interpret data so they can see trends, make predictions, and compare and contrast ideas about information
In prior years, students have worked with bar graphs, line plots, stem and leaf plots, and line graphs. In this unit, students extend their work with data to frequency tables and circle graphs. Students learn how to display graphs with and without technology. They also choose graphs that best represent a certain set of data and justify why they chose the graph that they did. They analyze graphs and identify features that can make graphs misleading.
Instructional activities begin with students conducting a simple statistical investigation, displaying the data, and discussing what they learned from the investigation. Later in the unit, students investigate measures of central tendency and discover which measure of central tendency is most representative for a given data set. Instructional activities include real world situations that are meaningful to the students. The unit concludes with a statistical investigation where students again collect, display, and interpret data.
